SOA troubleshooting must be performed in the following scenarios:
- The Oracle Fusion application transaction flow has an error and it has been identified as an error in SOA (or you want to check if it is a SOA-related error).
- The Oracle Fusion application transaction flow has not completed and is taking longer than it should and it has been identified as stuck in SOA (or you want to check if it is stuck in SOA).
- The Oracle Fusion application transaction flow is not working as expected, and the wrong data is passed.
- Check the server and composite status log in Oracle WebLogic Server Administration Console and check if the SOA server is up and running successfully (that is, not in a failed state).
- Log in to Oracle WebLogic Server Administration Console.
- In the Domain Structure, click Deployments.
- In the Name column of the Deployments section, find soa-infra.
- Check that the State column is set to Active and the Health column is set to OK.
- Click soa-infra > Monitoring tab.
- Expand to ensure that all components have Health set to OK.
- Note the server name on which SOA is deployed.
- Go to the Domain Structure and click Environment > Servers to verify that the State column is set to RUNNING and the Health column is set to OK.
- Note the Listen Port column value, as this is the SOA runtime port.
- Log in to Oracle WebLogic Server Administration Console.
- Check if any Oracle Fusion application incident was created for the problem encountered.
For information about Oracle Fusion application incident processing, see Section 17.4.1.
- Check whether the event was delivered to the SOA cluster by checking the log messages in Fusion Applications Control.
This requires the oracle.integration.platform.blocks.event logger to be set to TRACE:32 (FINEST). There are potentially many types of exceptions that can appear in the log messages on the client side that raised the event. For example:
- If a Java class is not in the class path, then a
ClassNotFoundExceptionmay appear.
- If the JNDI for the context or connection factory is not configured properly, then a
NamingExceptionorFabricExceptionmay appear.
- If the event payload XML that you create is invalid or contains invalid characters, you may receive a
FabricExceptionindicating that enqueueing of the event fails at the PL/SQL API with invalid characters, and so on.
- If a Java class is not in the class path, then a
- Check the composite instance flow. If the event was fired, then find your composite instance based on the application data.
See Section 21.3.1 for primary key mapping to the composite instance ID.
- Review the composite instance flow and fault details. If the instance is in error and it is recoverable, attempt recovery using the Recovery tab of the BPEL process service engine in Fusion Applications Control.
- View the logs.
If the problem still cannot be solved, increase the log level of the system to debug the transactions. See the list of loggers and log levels in the "Troubleshooting Oracle SOA Suite" appendix of Oracle Fusion Middleware Administrator's Guide for Oracle SOA Suite and Oracle Business Process Management Suite. To simplify troubleshooting, it is recommended that you enable the following parent loggers at the TRACE32 (FINEST) level in Fusion Applications Control:
- oracle.soa
- oracle.fabric
- oracle.integration
- Go to Fusion Applications Control.
- In the navigation pane, select WebLogic Domain.
- Right-click a Managed Server from within the domain (each server's log levels can be independently set).
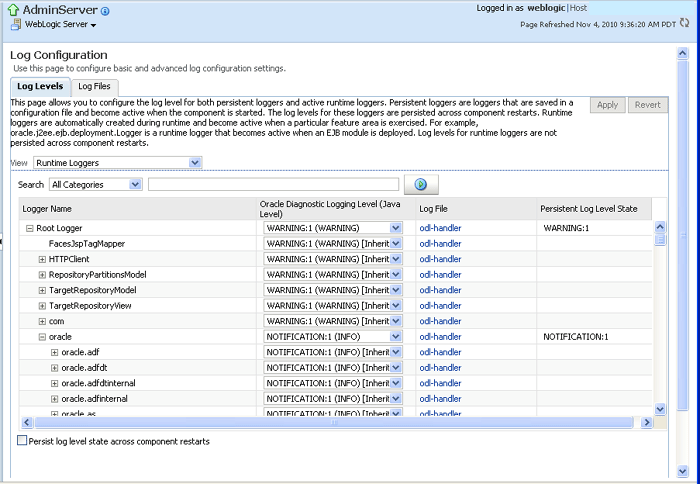
- Choose Logs > Log Configuration.
- In the Logger Name column, expand the oracle runtime loggers to display loggers such as oracle.soa.
- Change the logging level to TRACE:32. The change should take effect within a few minutes.

Description of the illustration loglevel.gif
Note that in a production system, setting the trace at a fine-grained level can result in a large amount of output that must be diagnosed. You can alternately use selective tracing that provides a way to get a detailed, on-disk trace selectively (for example, by user name, thereby eliminating trace output for other users).
- To activate selective tracing, right-click the domain under WebLogic Domain and choose Logs > Selective Tracing.
Note that Selecting Tracing does not display as an option when you right-click an Administration Server or Managed Server and choose Logs.
- From the Option Name list, choose the type of selective trace (for example, based on user name), and start the trace.
- When the problem has been reproduced, disable the trace and view the output to narrow down the issue.
For more information on selective tracing, see the "Configuring and Using Selective Tracing" section of Oracle Fusion Middleware Administrator's Guide.
- Review the error logs (from Fusion Applications Control) for more information on the error.
- oracle.soa


No comments:
Post a Comment